Understand business needs objectives
Propose tech stack, timelines architecture
Sprint-based development with regular demos
Final testing and go-live with complete documentation
Ongoing maintenance, upgrades scale-up
Understand business needs objectives
Propose tech stack, timelines architecture
Sprint-based development with regular demos
Final testing and go-live with complete documentation
Ongoing maintenance, upgrades scale-up

We help define the ideal stack
Our architects suggest best options
With estimation, milestones & approach
Flexible delivery model: fixed or dedicated

Get expert tech consultation at no cost.
Get Free Tech AdviceBrief us on your needs (tech stack, duration, etc.)
Receive matched profiles within 24–48 hours
Interview the candidates and choose the right fit
Kick off the project seamlessly with our support


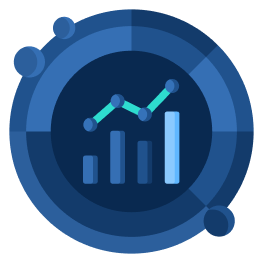
At Appeak Technology, we specialize in transforming complex data sets into visually appealing, interactive, and easy-to-understand charts, graphs, and dashboards. Our expertise spans across various industries, providing customized solutions tailored to your business requirements.

We convert raw data into compelling visual stories that help you grasp key trends, relationships, and outliers instantly. Whether you need real-time dashboards, interactive graphs, or engaging infographics, we ensure clarity and precision in every visual representation.

Our BI reporting services enable organizations to track key performance indicators (KPIs), generate comprehensive reports, and make data-backed decisions. We integrate BI tools such as Tableau, Power BI, and Google Data Studio to provide meaningful insights.

Data-driven organizations need robust analytics solutions. Our team at Appeak Technology helps in data collection, processing, and analysis to generate real-time and historical reports that facilitate better strategic planning.

Going beyond visualization, our DIaaS solutions provide AI-driven insights that predict trends, highlight anomalies, and offer prescriptive analytics. By integrating machine learning, we help businesses stay ahead in their industries.

We develop custom dashboards that align with your business needs. Whether you need sales analytics, operational efficiency tracking, or customer behavior analysis, our interactive dashboards ensure you have real-time data at your fingertips.
We convert raw data into compelling visual stories that help you grasp key trends, relationships, and outliers instantly. Whether you need real-time dashboards, interactive graphs, or engaging infographics, we ensure clarity and precision in every visual representation.
Tailored dashboards and reports that cater specifically to your industry and objectives.
Monitor key metrics and business performance effortlessly.
Leverage artificial intelligence to uncover hidden patterns and opportunities.
Our solutions are adaptable to businesses of all sizes, from startups to enterprises.
Track financial metrics, fraud detection, risk assessment.
Patient data analysis, treatment effectiveness, and operational efficiency.
Consumer behavior analytics, sales trends, and supply chain insights.
Student performance tracking, learning analytics, and administrative reporting.
Campaign performance analysis, ROI tracking, and audience insights.
Production monitoring, quality control, and supply chain optimization.

Gather relevant data from multiple sources and clean it for accuracy.
Create custom visualizations, reports, and interactive dashboards.
Use advanced analytics to uncover actionable insights.
Deploy the solution and provide hands-on training to your team.
Ensure continuous improvements and scalability as your business grows.
We work with leading tools like Power BI, Tableau, Google Data Studio, and Python-based visualization libraries.
No one-size-fits-all approach; every solution is crafted to fit your business needs.
Our AI-powered analytics help businesses gain predictive and prescriptive insights.
We integrate with existing enterprise systems to provide a unified data experience.
Data visualization is the process of transforming raw data into graphical representations like charts and graphs. It helps businesses quickly interpret complex data, identify patterns, and make informed decisions.
Our services cater to industries such as finance, healthcare, retail, education, marketing, and manufacturing. Any business that relies on data-driven decision-making can benefit from our solutions.
Yes! We create fully customized dashboards that align with your business objectives, whether it’s sales tracking, financial analysis, or customer behavior monitoring.
We use a variety of tools including Power BI, Tableau, Google Data Studio, Python (Matplotlib, Seaborn), and D3.js to create insightful visualizations.
Getting started is simple! Contact us via email at info@appeaktech.com or call +91 8799459079 for a free consultation.
With strategically located offices worldwide, our global presence ensures efficient delivery to clients across the globe, no matter the distance or destination.
B-622 Sun Westbank, Ashram Road, Ahmedabad 380009.
Unit 416, 91C Grima Street Schofields, NSW Australia, 2762